Extracting motor parameters from the graph
Related articles
- Measuring DC motor parameters
- Formulas for power calculations on ebikes and hub motors
- Simulation e-bike hub / mid-drive motor efficiency vs speed
- Permanent magnet DC electric motor tuning
Intro
Here we will extract the motor parameters of a 36V, 28" Cute Q-85SX hub motor from the motor graph, with the aim to run ebike simulations in Excel.
Motor parameters
A PM motor (permanent magnetic) can be characterized mainly by these parameters:
- Motor constant k
- Resistance R
- Friction torque Tf
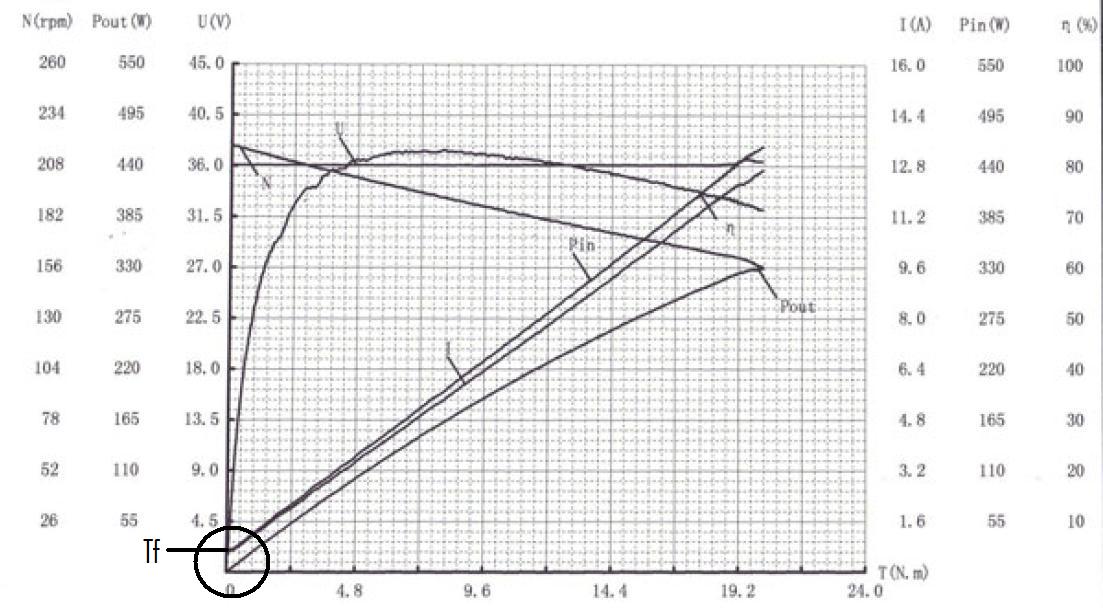
Commonly, instead of these motor parameters, a graph like this is included with an electric motor:

The mechanical losses, iron and core losses are not measured here. See here for the theory and formulas.
Motor graph creation
If we have the motor parameters we can create a motor graph without doing measurements.
- Tm = T * 100 / effG + Tf
- U = i * R + k * ω
- T = (k * i - Tf) * effG / 100
- Pout = T * ω
- Pin = U * i
- η [%] = 100 * Pout / Pin
From 1:
- i = (T * 100 / effG + Tf) / k
From 2 and 3:
- n = 60 / (2 * π ) * { U / k - (T * 100 / effG + Tf) * R / k2 }
From 4:
- Pout = T * 2 * π * n / 60
Extracting motor parameters from the graph
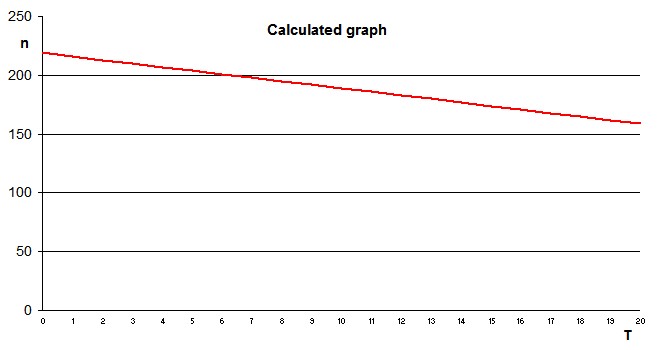
We can also extract the motor parameters from an existing graph. After the parameters are extracted, the motor graph can be drawn by our self again. When the parameter values are correct, the new graph matches the original graph.
Calculate kt and Rt
This Excel sheet helps you with the back-calculation of the motor parameters. We need the graph n [rpm] versus T [N.m]. If the motor contains a gearbox, the motor constant kt relates to the motor-gearbox combination.
The calculated motor resistance Rt from the graph is higher than the motor resistance measured directly, see here. The cause is that Rt includes the equivalence of all other motor losses. Although this approach is technically speaking not completely correct, we achieve a satisfactory motor graph with Rt.
- kt = U / (0.105 * n0)
- Rt = ( U – kt * 2 * π * n1 / 60) * kt / T1
Fill in from the graph:
- U = 36V
- T0 = 0 (no load)
- n0 = 218.4
- T1 = 19.20
- n1 = 161.2
The motor parameters k and Rt will be calculated automatically:
- kt = 1.57
- Rt = 0.77Ω
Calculate friction Tf
We need the graph i [A] versus n [rpm]. Fill in the Excel sheet the values from the graph, look inside the circle:
- i0 = 0.64
- n0 = 218.4
The friction Tf will be calculated automatically:
- Tf = P0 / ω0 = 1.0
Creating the graph with the extracted motor parameters
Now we have the values, fill in these motor parameters in this Excel sheet, second tab sheet.
- Rt = 0.77Ω
- kt = 1.57
- Tf = 1.0
- Motor temperature = 50°C
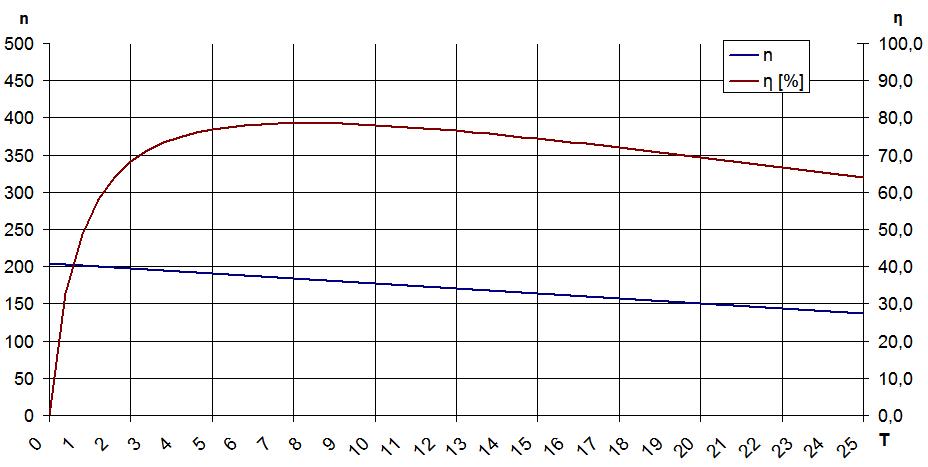
The graph doesn't match exactly the original motor graph:
To solve this, we have to adjust some motor parameters. Try out different values for Rt and Tf until the graph matches the original motor graph. For Tf, the value from these measurements is taken. With the following values, the graph matches exactly the original motor graph:
- Rt = 0.6Ω
- kt = 1.57
- Friction torque Tf = 0.82Nm
- Motor temperature = 50°C

Although the other motor losses are not known, we can satisfactory simulate several e-bike scenarios with these motor parameters.


